Remember my Competitive Intelligence at the Service of Affiliate Program Managers article at Search Engine People which appeared there back in May of this year? If you didn’t see it yet, that would be a good place to start before continuing reading this post… If, however, you did read it you know that — when spying on competing affiliate programs — among the “affiliate program & related performance” things to analyze I recommend looking at “best-performing creatives” and “wording of text links”.
Affiliates, don’t turn away from this post! You need this too. After all, by understanding what works best for other publishers in any given affiliate program you can better optimize your own campaigns.
Well, things aren’t that straightforward with banners and text links. Savvy affiliates and program managers know that not all banner (or text links) statistics should be taken at face value.
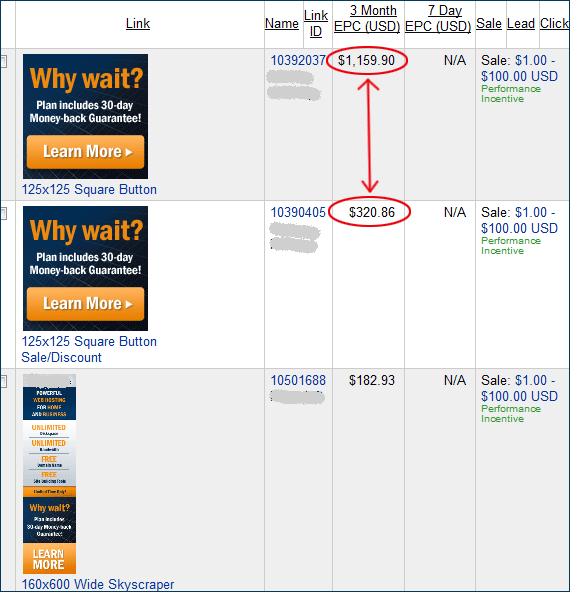
Here’s a perfect example I’ve recently spotted:

See the significant EPC difference between banner #1 and banner #2? No, it’s not because the first banner performs that much better. In fact, they are nearly identical (they’re animated banners, and the second frames, which you don’t see, are just a little different). The reason for this overinflated banner EPC is as simple as this: the first banner is higher on the list and easier for affiliates — who don’t necessarily want to use the banner itself but just need to quickly pick up an affiliate code!! — to use. Same often applies to text links (unless you’re comparing deep-linked ones).
As mentioned above, this is an important factor to grasp both for affiliates (not to make wrong conclusions), and for affiliate program managers (who, while engaging in competitive intelligence tasks, may make wrong conclusions as well). Do analyze what works best for others, but do keep in mind that not everything you see there (i.e. with banner and text links’ performance stats) it to be trusted as 100% accurate analytics.
Interesting. Isn’t EPC irrelevant to volume(in this particular purpose) though? It makes sense that more total sales may occur but that shouldn’t really effect the EPC. It should be proportional to the volume in most instances. Obviously if its a simple case of not enough volume to give a statistically accurate figure that is a valid point to make. Especially since that invalid statistic could be significantly higher or lower than the actual average.
Mike, I’m not sure I’m following. EPC is affiliate earnings measured against anything from 1 to 100 clicks (in our above case, it’s 100) referred to the merchant. If one creative (banner, text link, Flash, video, etc) shows as if generating an average affiliate EPC of $1160, and another – $321, affiliates get an impression that one is that much more effective than the other. However, this is frequently not so (as in the above-pictured scenario).
Right. So if each offer is the same, statistically their conversion rates should be identical when viewed as a percentage.
So although offer 1 may have 1000 people pushing it, while offer 2 may have just 100 people, the earnings per 100 clicks should be identical for both groups, right?
ie: affs push a total of 10,000 clicks, with a conversion rate of 5%, for a total combined commissioned of $1,000. Effectively making the EPC (as in above) $10.
affs push a total of 1,000 clicks, with a conversion rate of 5%, for a total combined commission of $100. Effective making the EPC (as in above) $10.
heh, perhaps I am not getting something 🙂 epcm always messes with my head.
That was exactly my point, Mike. Regardless of how many people click each of these two banners, if they’re nearly identical, their EPC should also be pretty close (or not differ that much).
I get the point of saying that the EPCs should be close but your suggestion that the only reason they are so different is because one has more volume doesn’t seem valid (in your post), your comment above kind of suggests a different aspect that something else is going on that might provide a higher epc.
What I was saying was that it’s incorrect to even compare the two, because the first one actually includes dozens of other ways people are using that banner’s URL (for deep-linked text, reviews, etc, etc). So, we’re then not comparing apples to apples at all. Does this make sense?
Thanks for sharing this. This means that those involved in affiliate marketing should really take a closer look at the data being presented.
Absolutely…and test both themselves to come up with the most valuable data of all, their own data 🙂
Thanks for explaining this. There are so many instances when stats are calculated incorrectly, from affiliate networks to Google Analytics… makes my head spin.